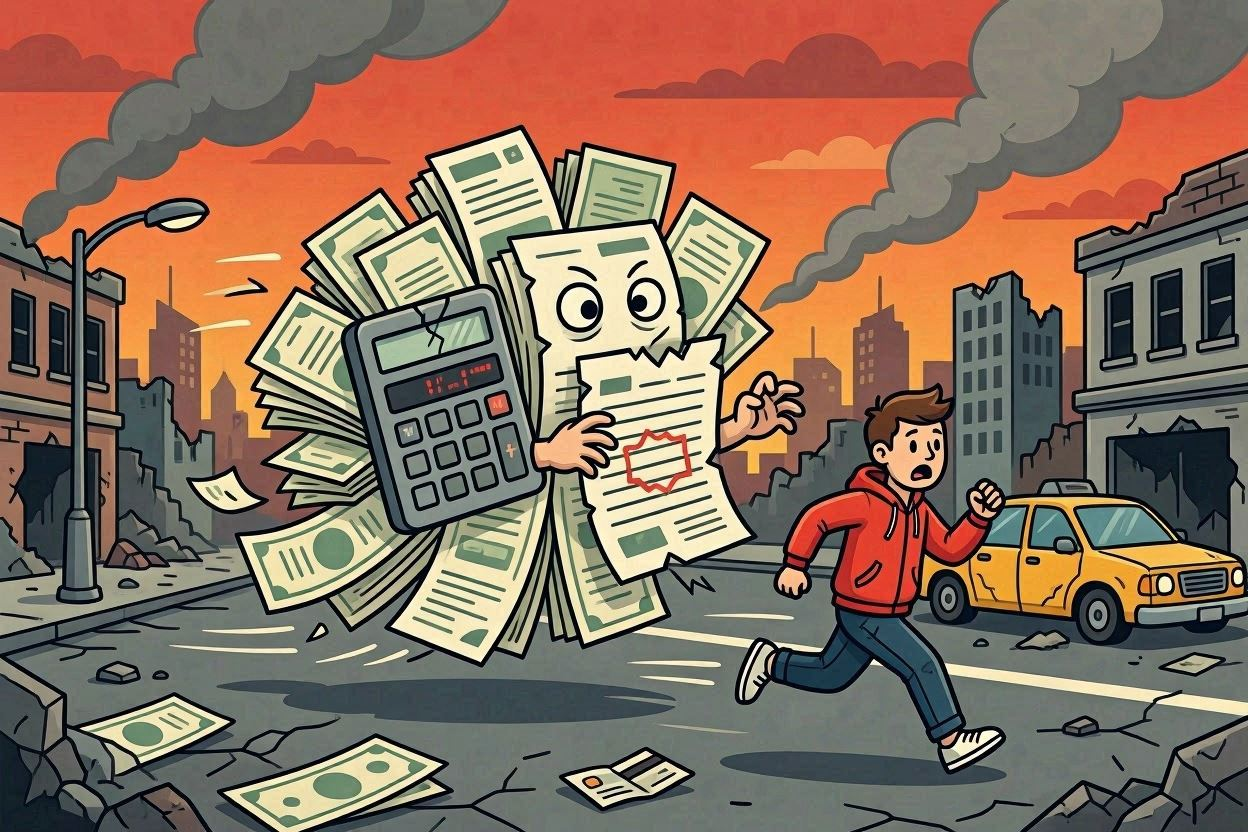
Confession time: I like Zombie movies. There I said it.
It’s relevant to this post, I promise. If you’ve started researching retirement planning seriously, you’ve probably encountered the phrase ‘sequence of returns risk‘ — possibly without a clear explanation of why it matters. Sequence of returns risk is the 28 Days Later of retirement planning. It’s scary, genuinely. But I think a short discussion might eliminate some fear here.
The core concern sequence of returns risk represents is this: “What if the bottom falls out of the market for the first few years I retire?”
A bad series of returns EARLY in retirement, mathematically, can get horrifying. If that happens you might find yourself fleeing a fast zombie horde (of course I mean a fast zombie horde financially). I am well aware this metaphor could break down quickly, but I’m going for something scary here, so go with me for a moment.
The concern that you’ll retire into a series of bad market returns is called Sequence of Returns Risk, sometimes “SOR”.
What Is Sequence of Returns Risk?”
Sequence of returns risk is the reason the 4% rule exists. The 4% rule models historical data and provides 4% as the safe withdrawal rate. It’s considered safe because it examines 30-year historical timepoints and identifies that 4% would have survived the WORST sequence of returns in history. Basically, 4% survives previous financial zombie apocalypses, so it’s considered safe.
Because the 4% rule is so foundational to financial planning, you could say that sequence of returns risk is at some level the foundational problem retirement planning is trying to solve.
Sequence of Returns risk is the reason that some would-be retirees decide to delay their retirement, waiting an extra few years, working longer or going back to work having retired.
SOR example
Imagine 2 portfolios worth 1 million each.
Portfolio 1: Joe Amazing retires into a booming bull market and his portfolio soars.
Portfolio 2: Jack Dumpsterfire retires into a sickly bear market – that zombie financial apocalypse we all dread – and his portfolio takes a beating.
Joe Amazing retires into three strong early years — +10%, +15%, +13% — before settling into steady 8% annual returns. His portfolio compounds through those early good years and his withdrawals represent a smaller and smaller share of a growing base. He hits his bad years late — years 26 through 28 — but by then his portfolio is large enough to absorb the losses. He ends year 28 with $3.1 million. Jack Dumpsterfire faces the exact mirror image: -10%, -15%, -13% in years one through three. Forced to sell depressed shares just to cover his $40,000 annual withdrawal, he permanently reduces the number of shares available to participate in the eventual recovery. He never catches up. He ends year 28 with just over $1 million — barely what he started with, despite 28 years of investing. The gap between them: $2 million. Same starting balance, same withdrawal, same average return. Different sequence.
Notice that as bad as Jack Dumpsterfire’s returns were early, he never runs out. But based on the first 3 years, he sees his portfolio shrink from a million to around $500,000. Imagine his anxiety as his portfolio shrinks by nearly half. That’s the real power of a bad sequence of returns. While it may not deplete your nest egg fully, it’s like living through a pandemic. You never really know what’s coming, and the terror is real.
Outrunning the zombies: managing SOR risk
Here are a few ideas of how you can stay ahead of an apocalypse and manage your SOR risk:
- Cash buffer — hold 1-2 years of spending in cash so you don’t have to sell equities in a down market.
- Keep your spending needs flexible — reduce withdrawals in bad years if possible (the “guardrails” approach)
- Delay Social Security — higher SS income reduces portfolio dependency, which reduces sequence exposure. It’s counterintuitive, but between ages 62 and 70, SS benefits increase approximately 8% for each year you delay. Holding off can benefit you in a down market.
- Part-time income in early retirement — even $1,000/month reduces portfolio withdrawals by $12,000/year during the highest-risk period
Modeling SOR risk
The DIY Retiree Retirement Probability Calculator models some apocalyptic investment returns so you can see how your portfolio might fare in the apocalypse.
- The Retirement Probability Calculator runs a Monte Carlo simulation of 2,000 different return sequences, many of which start with bad years.
- The fan chart shows the spread of outcomes — the gap between the 10th and 90th percentile bands is largely driven by sequence risk
- The success rate reflects all those sequences — an 85% success rate means the portfolio survived 1,700 out of 2,000 sequences including the worst historical starting years
If you try running the sequence with your numbers, you will indeed see some scary SOR ‘tails’ in your red (bottom 10%) sequences on the right of the graph. This is your bottom 10th percentile outcomes, so they represent the worst possible sequences of returns the model can think of.
Unafraid of the apocalypse
If you think too long about it, there are always those possible scenarios where the market implodes and we end up in a zombie apocalypse. The market crash of 1929 and the high inflation/low return period in the late 1960s/ early 1970s were the longest and worst on record. But the market came back in those scenarios, and despite 100 years of data, there are only a few worst-case scenarios for a portfolio of 30 years. Understanding the math means that you can think about how to be more prepared for this worst-case scenario. The goal is building a plan that survives the bad sequences, not just the average ones. If your plan is strong enough, you may even be prepared for fast zombies.
Tony Markey, MBA, founded DIY Retiree to provide free retirement planning tools and straight-talk guidance for pre-retirees managing their own financial futures. Read more about his story here
1 thought on “Sequence of Returns Risk”